 |
A novel procedure for combining ozone measurements from
existing satellites has led to global maps of tropospheric ozone, such
as those illustrated here. The new analysis technique is conceptually
simple. The amount of ozone in the stratosphere as determined from
measurements by a limb viewing instrument, such as the SAGE II
instrument, is subtracted from the total amount of ozone as determined
from a nadir viewing instrument, such as the TOMS instrument. The
resulting difference in ozone concentration, called the tropospheric
ozone residual (TOR), is the amount of ozone in the lower regions of
the atmosphere.
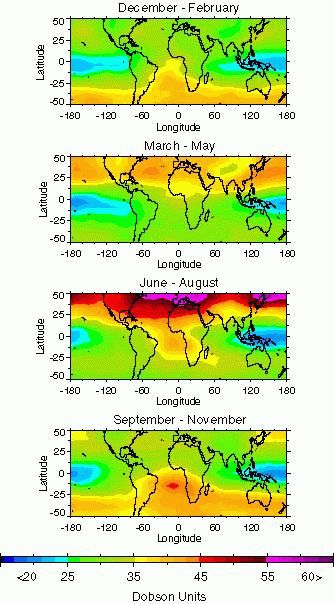
The left panel depicts the average of the tropospheric
residuals obtained using this analysis technique for four seasons .
The high concentrations of tropospheric ozone observed in the northern
hemisphere for the June- August season was expected, knowing that most
industrial emissions occur in the northern mid-latitudes. Totally
unexpected was the enhanced concentrations of tropospheric ozone
observed during the September-November time period in the tropical
Atlantic ocean between southern Africa and South America.
The TRACE-A mission was initiated to determine the cause of
this large pool of ozone. Notice also that the September - November
tropospheric ozone residuals tend to spread in a latitudinal zone,
centered on 30 degrees south, into the Indian ocean and, eventually,
into the Pacific ocean. The
PEM-Tropics mission, completed in September, 1996, observed
plumes of enhanced ozone throughout the tropical Pacific, which were
clearly associated with biomass burning. |